Data is the key to win today’s world and it has been proved time and time again. Whether it is a well-established business or a small startup, an educational institution, or a healthcare organization, in every sector data plays an important role.
A well collected and timely updated data helps to offer efficient, data-driven services and keep tabs on the effects and changes. Data in raw form is intimidating and it needs a platform to transform into appealing reports.
Microsoft Power BI was developed solely for that purpose. If followed correctly, best practices Power BI have the potential to transform the way data is conceived and consumed.
Power BI works as a potent tool for all types of businesses and organizations to create innovative, robust, and interactive reports and dashboards and use the data in the best way possible to make better data-driven decisions and positively impact all the stakeholders.
Before we dig deeper into the various best practices of Microsoft Power BI, it’s important to brush up on some basics.
What is the Power BI?
Power BI is a cloud-based analytics service offering business intelligence and analytics solutions. It is a data mining and business intelligence (BI) tool developed by Microsoft and released on 11th July 2011
It offers robust and sophisticated data analysis, data visualization, and visual interactions with greater speed, efficiency, and easy-to-use features.
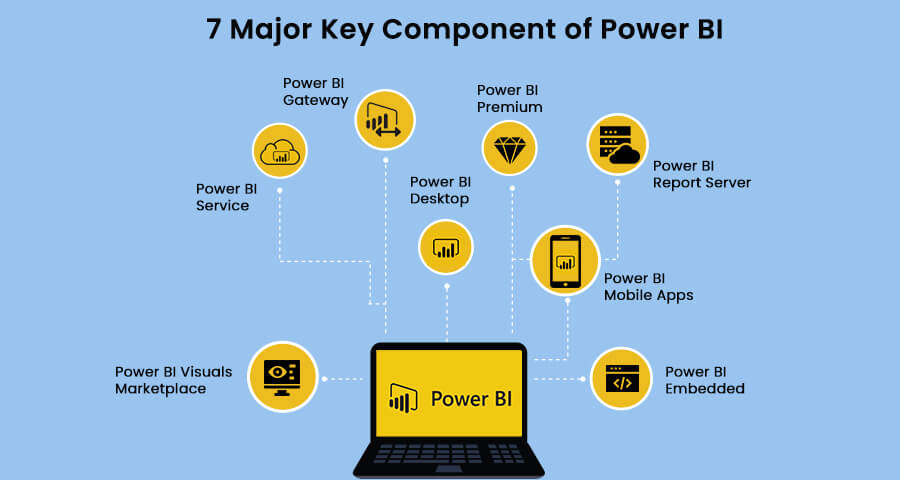
Power BI has seven major key components.

- Power BI Desktop – Windows desktop-based application for PCs and desktops.
- Power BI Service – SaaS-based online service formerly as Power BI for Office 365.
- Power BI Mobile Apps – Power BI apps for Android, iOS & Windows mobile devices.
- Power BI Gateway – Syncing service of external data in and out of Power BI.
- Power BI Embedded – REST API to build dashboards and reports into custom apps.
- Power BI Report Server – On-Premises Power BI Reporting solution for companies.
- Power BI Premium – Capacity-based offering with greater scale and performance.
- Power BI Visuals Marketplace – Marketplace of custom visuals and R-powered visuals.
Check our Power BI Documentation to learn more: A Walkthrough of Microsoft Power BI
Now that we have made the basics clear. Let’s get to the main topic of why we are here:
What are the 5 best practices of Power BI?
Power BI is an effective reporting solution and robust business intelligence and analytics solution. It offers optimal performance and security, data visualization with visual interactions.
Microsoft Power BI performance is further boosted by scores of pre-made data models that can be used to quickly create Power BI reports.

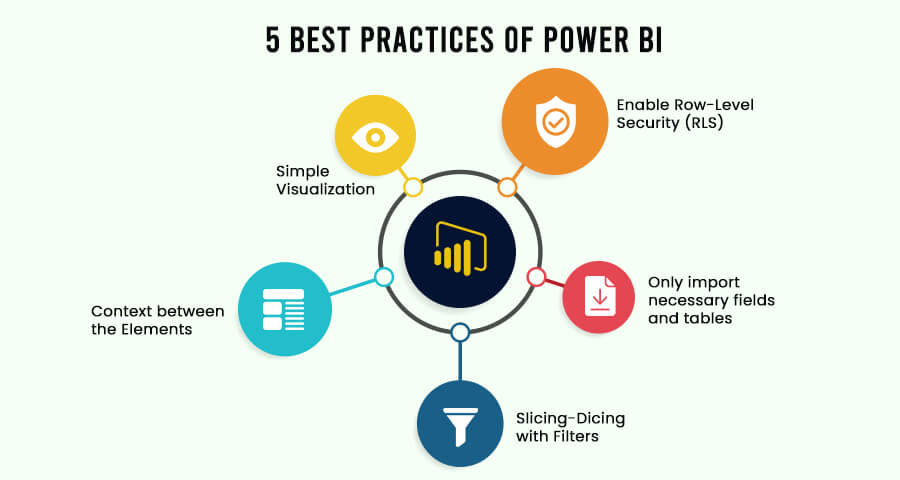
Given below are 5 best practices of Power BI that can enhance the Power BI developments.
1. Simple Visualization
Simplicity is beauty and it is true for Power BI too, with so many options available for data visualization it becomes tempting to use innovative and complex visuals. These make the report look more dashing but hamper the understanding of the audience.
According to Microsoft’s Optimization guide for Power BI, numerous visuals in a single report hinders the performance. Use 1 grid per page and less than 8 widget visuals per report page and keep the points below 30 & tiles below 10 per dashboard.
2. Slicing-Dicing with Filters
Power BI filters are one of the top features that make visual interactions possible and make the data easy. The report and visual data can be easily configured to show specific data according to different criteria and fields.
When slicing and dicing with filters one must consider that the larger the data that needs to display, the slower it will load, as it needs more memory which leads to a decline in performance.
3. Context between the Elements
Data is good only if there is a context between the various elements and it offers the agility to navigate. Using the cross-filtering capability of Power BI two charts with connected data will be filtered simultaneously once clicked on the element on one chart.
Including context between elements greatly enhances the data comparison, visual analysis and offers reports for all scales – from in-depth reports to overview, and all in between.
4. Enable Row-Level Security (RLS)
RLS enabled Power BI only imports the data that the user is authorized to view. It restricts access to certain data, based on predefined rules that can be set easily.
This helps in data security and data governance and allows access of data to a user based on his role. It makes the design and coding of the application’s security simpler and easier.
5. Only import necessary fields and tables
Importing only the necessary fields and tables offers optimal performance. No need to import the entire datasets, keep the data models as narrow and lean as possible.
Power BI works on columnar indexes and longer and leaner are preferred.
Not importing unnecessary data will use lee Power BI memory and the work can be completed more efficiently.
Conclusion:
Microsoft Power BI is an amazing tool that can revolutionize the way data is consumed by stakeholders. Power BI offers robust reporting solutions & innovative and sophisticated business intelligence and analytics solutions.
It offers powerful data visualization & visual interactions with pre-made data models, optimal performance, and security. Using Power BI effectively with best practices of Power BI can lead to easier creation, simpler navigation, and a better understanding of data to stakeholders.
SA Technologies is an authorized Microsoft Power BI Partner and has been helping organizations to thrive with top-notch consultancy, help, management, and implementation of business intelligence tools for over a decade.


